In this article
Executive Summary:
- Analysis of the US market (2019-2024) shows quant funds outperformed traditional funds (S&P 500) on a risk-adjusted basis.
- Simulation suggests incorporating quant funds into Indian portfolios could enhance returns and Sharpe ratios.
- However, adoption in India faces barriers; international solutions should be considered.
Introduction
- Quant investing uses algorithms and data for trading, unlike traditional methods relying on human judgment.
- Global interest in quant is rising due to technology and data availability.
- Quant adoption in India is growing, with investors seeking alternatives.
- This report compares US quant and traditional fund performance (2019-2024) and simulates Indian retail investor impact using provided data.
US Quant vs. Traditional Fund Performance (2019-2024)
- Investment performance is influenced by market cycles (bull vs. bear).
- The S&P 500 experienced several phases between 2019 and 2024:
- Prolonged bull market (Mar 2009 – Feb 2020)
- Brief bear market (Feb 2020 – Mar 2020) – COVID-19 impact
- Strong bull market (Mar 2020 – Jan 2022) – stimulus and recovery
- Sustained bear market (Jan 2022 – Oct 2022) – inflation and rate hikes
- New bull market (Oct 2022 – End 2024) – significant gains in 2023/24.
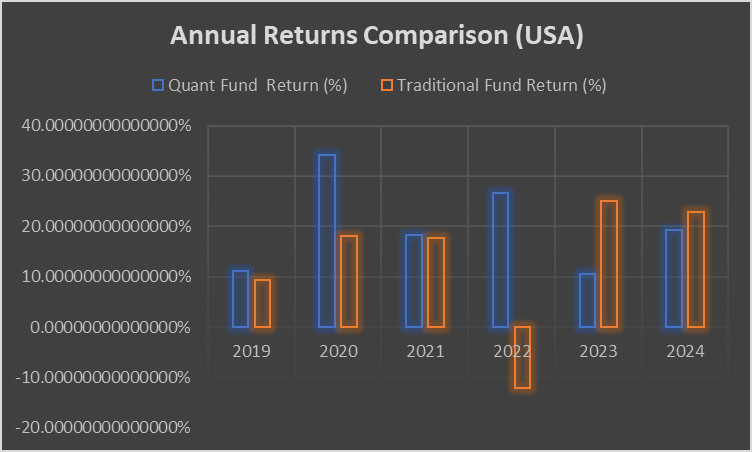
- Annual Returns: Refer to Table 1: Annual Returns of Quant Funds vs. S&P 500 (USA, 2019-2024).
- Some quant funds (e.g., D.E. Shaw funds) showed consistent positive returns, even in the 2022 bear market.
- Renaissance – Institutional Equities Fund had a significant loss in 2020 but strong gains afterward.
- The S&P 500 showed positive returns in most years but a substantial drop in 2022, highlighting its sensitivity to market downturns.
- Some quant strategies demonstrated an ability to navigate adverse market conditions profitably.
- Overall Performance Metrics: Refer to Table 2: Overall Performance Metrics: Quant vs. Traditional Fund (USA, 2019-2024).
- The average quant fund had a higher average return (19.970%) and a lower standard deviation (8.360%) compared to the S&P 500 (13.4975% average return, 12.468% standard deviation).
- The Sharpe ratio (risk-adjusted return, assuming zero risk-free rate) was significantly higher for the average quant fund (2.389) than the S&P 500 (1.083).
- This suggests quant funds provided better returns per unit of risk with less volatility during this period.
- Consistency of Returns:
- Individual quant fund returns varied, reflecting different strategies (see Table 1).
- The S&P 500’s negative return in 2022 shows its direct link to broad market movements (see “Input_Data” table).
- While average quant performance was strong, investors should note that individual quant fund consistency can vary.
Quant Adoption Simulation for common investor in India
- A normalization approach was used to estimate potential Indian quant fund returns based on US data.
- Normalization ratio (1.116) was calculated by comparing 10-year average returns of S&P 500 (0.114) and Nifty 50 (0.128).
- Nifty 50 data served as a proxy for the Traditional Fund in the Indian simulation.
- Simulated Performance: Refer to the table titled “DATA“.
- The simulated Quant Fund showed a higher average return (22.289%), lower standard deviation (9.331%), and a better Sharpe ratio (2.389) compared to the Traditional Fund (Nifty 50 proxy: 12.358% average return, 10.760% standard deviation, 1.148 Sharpe ratio).
- This normalization provides a simplified estimate and doesn’t fully capture Indian market nuances.
- Portfolio Allocation Scenarios: Refer to the table titled “Quant Adoption Simulation“.
- Five scenarios (A to E) explored different allocations to quant and traditional funds.
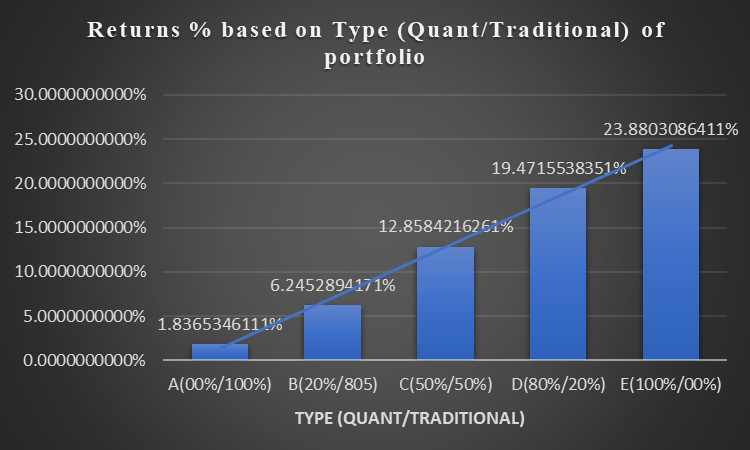
- Higher quant allocations generally led to increased returns. Portfolio A (0% quant) had a 12.358% return, while Portfolio E (100% quant) reached 22.289%.
- The Sharpe ratio peaked at a 50% quant allocation (2.900).
- Mixed portfolios (B, C, D) often showed lower volatility than pure traditional or pure quant portfolios, suggesting diversification benefits.
- Resilience During Downturns:
- Drawing from the US market in 2022 (Table 1), quant funds showed resilience.
- Higher Sharpe ratios in the Indian simulation for quant-allocated portfolios suggest potential for better risk-adjusted returns during downturns.
- Investment Growth Simulation (₹10,000,000 Initial Investment): Refer to tables “Quant Adoption Simulation-2019” to “Quant Adoption Simulation-2024” and corresponding “DATA-2019” to “DATA-2024“.
- Simulations of investments made annually from 2019 to 2024 and held until 2024 generally indicate that higher quant allocations resulted in greater accumulated amounts.
- This suggests quant-heavy portfolios might offer better long-term outcomes, potentially by mitigating volatility.
- Long-Term Forecast: Refer to the table titled “Quant Adoption Simulation (Forecasted)“.
- Projections based on average returns suggest significantly higher potential returns for portfolios with greater quant allocations over longer periods (1 to 20 years).
Early performace Insights:
Early Performance Insights:
- US analysis (2019-2024, Table 2) indicates selected quant funds outperformed the S&P 500 on a risk-adjusted basis (higher returns, lower volatility).
- Indian simulation (Quant Adoption Simulation table) suggests incorporating quant funds could improve returns and Sharpe ratios for retail investors.
- Investment growth simulations (Quant Adoption Simulation-2019 to -2024 tables) hint at the potential for quant-heavy portfolios to outperform, possibly showing more resilience in volatile markets.
- However, widespread quant adoption in India faces challenges: lack of understanding, model/data risk concerns, liquidity issues, and preference for traditional options.
- Learning from international solutions focusing on financial literacy, user-friendly tech, supportive regulations, and transparency is crucial for promoting quant investing in India.
Table 1: Annual Returns of Quant Funds vs. S&P 500 (USA, 2019-2024)
| Fund | 2019(%) | 2020(%) | 2021(%) | 2022(%) | 2023(%) | 2024(%) |
|---|---|---|---|---|---|---|
| D.E. Shaw – Oculus Fund | 11.70 | 25.40 | 15.00 | 20.00 | 7.80 | 36.00 |
| D.E. Shaw – Composite Fund | 10.40 | 19.40 | 18.50 | 24.70 | 9.60 | 18.00 |
| Renaissance – Medallion Fund | n/a | 76.00 | n/a | n/a | n/a | 30.00 |
| Renaissance – Institutional Equities Fund | n/a | -19.90 | n/a | n/a | n/a | 22.70 |
| Schonfeld – Strategic Partners | n/a | n/a | n/a | n/a | 3.00 | 19.70 |
| AQR – Helix Fund | n/a | n/a | n/a | 49.10 | 14.30 | 17.90 |
| AQR – Apex Fund | n/a | n/a | n/a | 17.10 | 16.20 | 15.10 |
| Citadel – Wellington Fund | n/a | 24.40 | 26.30 | 38.10 | 12.60 | 15.10 |
| Millennium Management | n/a | 26.00 | 13.50 | 10.20 | 10.00 | 15.00 |
| Two Sigma – Absolute Return Enhanced Strategy | n/a | n/a | n/a | n/a | n/a | 14.30 |
| CFM – Stratus Fund | n/a | n/a | n/a | n/a | n/a | 14.22 |
| CFM – Discus Fund | n/a | n/a | n/a | n/a | n/a | 12.01 |
| S&P 500 | 9.25 | 18.16 | 17.76 | -12.08 | 25.01 | 22.88 |
Key Insights from the Data highlights the varying annual performance of individual quant funds compared to the S&P 500, showcasing that while some quant funds maintained positive returns even during downturns, others experienced more volatility.
Table 2: Overall Performance Metrics: Quant vs. Traditional Fund (USA, 2019-2024)
| Metric | Quant Fund (Average) | Traditional Fund (S&P500) |
|---|---|---|
| Average Return (%) | 19.970 | 13.4975 |
| Standard Dev (%) | 8.360 | 12.468252 |
| Sharpe Ratio | 2.388799275 | 1.082550549 |
Key Insights from the Data provides a clear quantitative comparison, demonstrating that, on average, the analyzed quant funds in the US achieved higher average returns and Sharpe ratios with lower standard deviation than the traditional S&P 500.
Graph 1: Showing annual return comparison of quant vs traditional fund from year 2019 to 2024.
Graph 2: Showing different parameters for comparison between quant & traditional fund in USA
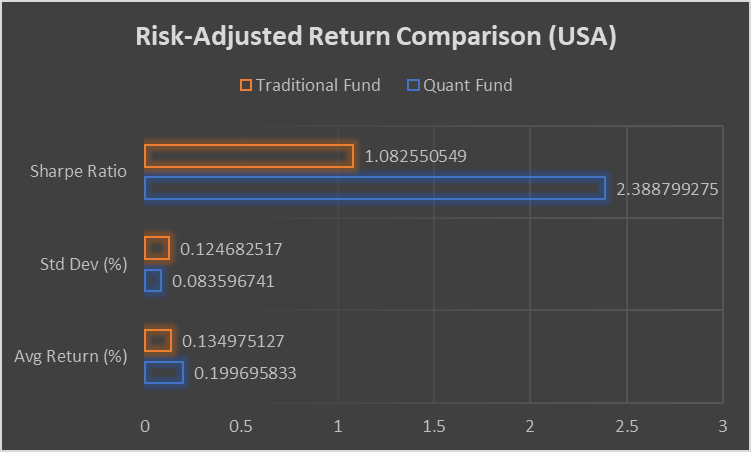
Table 3: Indian Market Simulation Parameters
| Metric | S&P 500 | Nifty 50 |
|---|---|---|
| Average Monthly Return | 0.91% | 0.010056223 |
| Average Yearly Return | 0.11430293 | 0.127577978 |
| Normalization Ratio | 1.116139174 |
Key Insights from the Data: The Indian Market Simulation Parameters (Table 3) establish the normalization ratio used to adapt US quant fund data for the Indian context, based on historical S&P 500 and Nifty 50 returns.
Table 4: Quant Adoption Simulation Results (India)
| Type | Quant Fund(%) | Traditional Fund(%) | Returns(%) | Std Dev(%) | Sharpe Ratio(%) |
|---|---|---|---|---|---|
| A | 0% | 100% | 12.357807% | 0.107602717 | 1.148466048 |
| B | 20% | 80% | 14.344012% | 0.082445918 | 1.739808657 |
| C | 50% | 50% | 17.323321% | 0.059744719 | 2.899556799 |
| D | 80% | 20% | 20.302629% | 0.071231196 | 2.850243988 |
| E | 100% | 0% | 22.288834% | 0.093305597 | 2.388799275 |
Key Insights from the Data: Results from the Quant Adoption Simulation in India indicate a positive correlation between the allocation to quant funds and the potential returns and Sharpe ratios of a portfolio.
Graph 3: Return % based on Type of portfolio (Quant/Traditional Fund) for the year 2024.
Graph 4: Sharpe ratio based on Type of portfolio (Quant/Traditional Fund) for the year 2024.
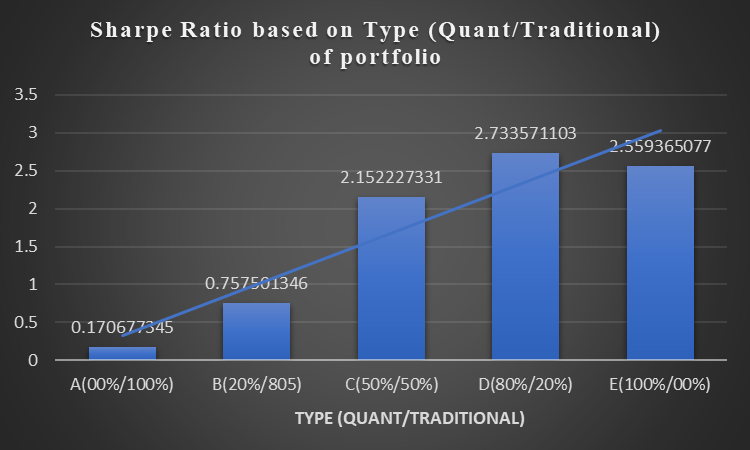
Table 5: Projected Investment Value by Year and Allocation (India, Investment of ₹10,000,000 in 2019)
| Allocation (Quant/Traditional) | Amount in 2024 (₹) |
|---|---|
| A (0%/100%) | 1,95,30,085.65 |
| B (20%/80%) | 2,25,82,064.45 |
| C (50%/50%) | 2,76,86,495.11 |
| D (80%/20%) | 3,34,31,877.13 |
| E (100%/0%) | 3,76,18,649.36 |
Key Insights from the Data: shows the projected growth of a ₹10,000,000 investment under different quant/traditional allocations, suggesting that higher quant allocations could lead to greater accumulated value over the analyzed period.
Graph 5: ₹10,000,000 invested in 2019 value in 2024 based on Type (Quant/Traditional) of portfolio
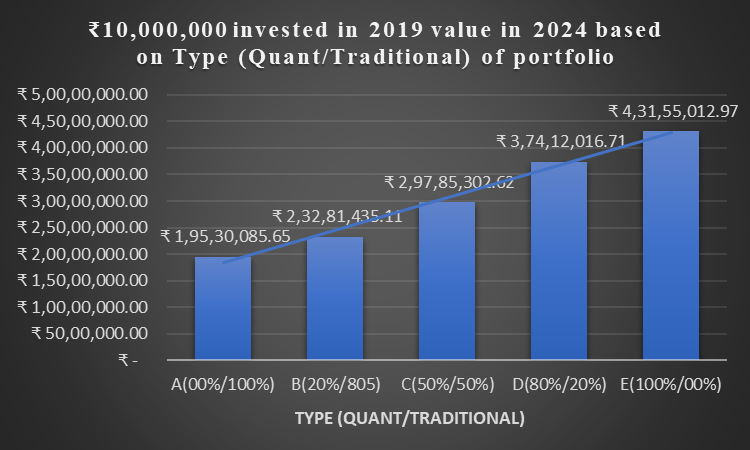
Table 6: DATA
| Fund Name | Avg Return(%) | Std Dev(%) | Sharpe Ratio |
|---|---|---|---|
| Quant Fund | 22.28883% | 9.33056% | 2.388799275 |
| Traditional Fund | 12.35781% | 10.76027% | 1.148466048 |
Table 7: Quant Adoption Simulation
| Type | Quant Fund | Traditional Fund | Retirns(%) | Std Dev(%) | Sharpe Ratio |
|---|---|---|---|---|---|
| A | 0% | 100% | 12.357807% | 0.107602717 | 1.148466048 |
| B | 20% | 80% | 14.344012% | 0.082445918 | 1.739808657 |
| C | 50% | 50% | 17.323321% | 0.059744719 | 2.899556799 |
| D | 80% | 20% | 20.302629% | 0.071231196 | 2.850243988 |
| E | 100% | 0% | 22.288834% | 0.093305597 | 2.388799275 |
Table 8: Input_Data (for Indian Market Simulation)
| S&P 500 | NIFTY 50 | |
|---|---|---|
| Average monthly return | 0.91% | 0.010056223 |
| Average yearly return | 0.11430293 | 0.127577978 |
| Normalisation ratio | 1.116139174 |
Table 9: Input_Data (for Forecasting)
| S No. | Year | Quant Fund Return(%) | Year | Traditional Fund Return(%) |
|---|---|---|---|---|
| 1 | 2019A | 11.05000000% | 2019A | 3.423522% |
| 2 | 2020A | 34.24000000% | 2020A | 21.459861% |
| 3 | 2021A | 18.32500000% | 2021A | 23.171197% |
| 4 | 2022A | 26.53333333% | 2022A | -0.207038% |
| 5 | 2023A | 10.50000000% | 2023A | 24.462764% |
| 6 | 2024A | 19.16916667% | 2024A | 1.836535% |
Table 10: DATA-2019
| Fund Name | Return (%) | Std Dev (%) | Sharpe Ratio |
| Quant Fund | 12.33334% | 9.33056% | 1.32182187 |
| Traditional Fund | 3.42352% | 10.76027% | 0.318163192 |
Table 11: Quant Adoption Simulation-2019
| Type | Quant Fund | Traditional Fund | Returns % | 1 year Return | Std Dev (%) | Sharpe Ratio | Amount in 2024 |
| A | 0% | 100% | 3.423522% | 10342352.24 | 0.107602717 | 0.318163192 | ₹ 1,95,30,085.65 |
| B | 20% | 80% | 5.205485% | 10520548.55 | 0.082445918 | 0.631381832 | ₹ 2,25,82,064.45 |
| C | 50% | 50% | 7.878430% | 10787843.01 | 0.059744719 | 1.318682274 | ₹ 2,76,86,495.11 |
| D | 80% | 20% | 10.551375% | 11055137.48 | 0.071231196 | 1.481285645 | ₹ 3,34,31,877.13 |
| E | 100% | 0% | 12.333338% | 11233333.79 | 0.093305597 | 1.32182187 | ₹ 3,76,18,649.36 |
Table 12: DATA-2020
| Fund Name | Return (%) | Std Dev (%) | Sharpe Ratio |
| Quant Fund | 38.21661% | 9.33056% | 4.095853469 |
| Traditional Fund | 21.45986% | 10.76027% | 1.994360481 |
Table 13: Quant Adoption Simulation-2020
| Type | Quant Fund | Traditional Fund | Returns % | 1 year Return | Std Dev (%) | Sharpe Ratio | Amount in 2024 |
| A | 0% | 100% | 21.459861% | 12145986.07 | 0.107602717 | 1.994360481 | ₹ 2,35,51,813.17 |
| B | 20% | 80% | 24.811210% | 12481120.96 | 0.082445918 | 3.00939211 | ₹ 2,49,98,475.62 |
| C | 50% | 50% | 29.838233% | 12983823.30 | 0.059744719 | 4.994287982 | ₹ 2,70,58,236.60 |
| D | 80% | 20% | 34.865256% | 13486525.64 | 0.071231196 | 4.894661114 | ₹ 2,89,54,451.68 |
| E | 100% | 0% | 38.216605% | 13821660.53 | 0.093305597 | 4.095853469 | ₹ 3,01,11,344.17 |
Table 14: DATA-2021
| Fund Name | Return (%) | Std Dev (%) | Sharpe Ratio |
| Quant Fund | 20.45325% | 9.33056% | 2.19207111 |
| Traditional Fund | 23.17120% | 10.76027% | 2.153402569 |
Table 15: Quant Adoption Simulation-2021
| Type | Quant Fund | Traditional Fund | Returns % | 1 year Return | Std Dev (%) | Sharpe Ratio | Amount in 2024 |
| A | 0% | 100% | 23.171197% | 12317119.68 | 0.107602717 | 2.153402569 | ₹ 1,58,65,572.25 |
| B | 20% | 80% | 22.627608% | 12262760.75 | 0.082445918 | 2.744539444 | ₹ 1,73,95,093.28 |
| C | 50% | 50% | 21.812224% | 12181222.36 | 0.059744719 | 3.650904061 | ₹ 1,97,74,790.91 |
| D | 80% | 20% | 20.996840% | 12099683.96 | 0.071231196 | 2.947702819 | ₹ 2,22,38,819.20 |
| E | 100% | 0% | 20.453250% | 12045325.04 | 0.093305597 | 2.19207111 | ₹ 2,39,17,377.35 |
Table 16: DATA-2022
| Fund Name | Return (%) | Std Dev (%) | Sharpe Ratio |
| Quant Fund | 29.61489% | 9.33056% | 3.173967447 |
| Traditional Fund | -0.20704% | 10.76027% | -0.019240922 |
Table 17: Quant Adoption Simulation-2022
| Type | Quant Fund | Traditional Fund | Returns % | 1 year Return | Std Dev (%) | Sharpe Ratio | Amount in 2024 |
| A | 0% | 100% | -0.207038% | 9979296.25 | 0.107602717 | -0.019240922 | ₹ 1,26,48,614.82 |
| B | 20% | 80% | 5.757349% | 10575734.85 | 0.082445918 | 0.698318197 | ₹ 1,35,49,891.27 |
| C | 50% | 50% | 14.703928% | 11470392.76 | 0.059744719 | 2.461125927 | ₹ 1,48,90,895.52 |
| D | 80% | 20% | 23.650507% | 12365050.67 | 0.071231196 | 3.320245636 | ₹ 1,62,08,414.42 |
| E | 100% | 0% | 29.614893% | 12961489.27 | 0.093305597 | 3.173967447 | ₹ 1,70,67,939.13 |
Table 18: DATA-2023
| Fund Name | Return (%) | Std Dev (%) | Sharpe Ratio |
| Quant Fund | 11.71946% | 9.33056% | 1.256029831 |
| Traditional Fund | 24.46276% | 10.76027% | 2.273433625 |
Table 19: Quant Adoption Simulation-2023
| Type | Quant Fund | Traditional Fund | Returns % | 1 year Return | Std Dev (%) | Sharpe Ratio | Amount in 2024 |
| A | 0% | 100% | 24.462764% | 12446276.36 | 0.107602717 | 2.273433625 | ₹ 1,26,74,856.53 |
| B | 20% | 80% | 21.914103% | 12191410.31 | 0.082445918 | 2.657997334 | ₹ 1,28,37,928.24 |
| C | 50% | 50% | 18.091112% | 11809111.25 | 0.059744719 | 3.028068904 | ₹ 1,30,49,404.56 |
| D | 80% | 20% | 14.268122% | 11426812.18 | 0.071231196 | 2.003072057 | ₹ 1,32,21,123.39 |
| E | 100% | 0% | 11.719461% | 11171946.13 | 0.093305597 | 1.256029831 | ₹ 1,33,13,515.11 |
Table 20: DATA-2024
| Fund Name | Return (%) | Std Dev (%) | Sharpe Ratio |
| Quant Fund | 21.39546% | 9.33056% | 2.293051921 |
| Traditional Fund | 1.83653% | 10.76027% | 0.170677345 |
Table 21: Quant Adoption Simulation-2024
| Type | Quant Fund | Traditional Fund | Returns % | 1 year Return | Std Dev (%) | Sharpe Ratio | Amount in 2024 |
| A | 0% | 100% | 1.836535% | 10183653.46 | 0.107602717 | 0.170677345 | ₹ 1,01,83,653.46 |
| B | 20% | 80% | 5.748319% | 10574831.93 | 0.082445918 | 0.697223024 | ₹ 1,05,74,831.93 |
| C | 50% | 50% | 11.615996% | 11161599.62 | 0.059744719 | 1.944271644 | ₹ 1,11,61,599.62 |
| D | 80% | 20% | 17.483673% | 11748367.32 | 0.071231196 | 2.454496659 | ₹ 1,17,48,367.32 |
| E | 100% | 0% | 21.395458% | 12139545.78 | 0.093305597 | 2.293051921 | ₹ 1,21,39,545.78 |
Table 22: Quant Adoption Simulation (Forecasted)
| Type | Quant Fund | Traditional Fund | Returns % | 1 year Return | Std Dev (%) | Sharpe Ratio | Amount after 5 years | Amount after 10 years | Amount after 15 years | Amount after 20 years |
| A | 0% | 100% | 12.35780677% | 11235780.68 | 10.760271741% | 1.148466048 | ₹ 1,79,06,729.19 | ₹ 3,20,65,095.04 | ₹ 5,74,18,097.34 | ₹ 10,28,17,031.99 |
| B | 20% | 80% | 13.88016208% | 11388016.21 | 8.244591844% | 1.683547511 | ₹ 1,91,53,157.63 | ₹ 3,66,84,344.72 | ₹ 7,02,62,103.70 | ₹ 13,45,74,114.77 |
| C | 50% | 50% | 16.16369505% | 11616369.50 | 5.974471861% | 2.705460068 | ₹ 2,11,52,031.78 | ₹ 4,47,40,844.82 | ₹ 9,46,35,977.14 | ₹ 20,01,74,319.55 |
| D | 80% | 20% | 18.44722802% | 11844722.80 | 7.123119575% | 2.589768124 | ₹ 2,33,14,414.19 | ₹ 5,43,56,190.91 | ₹ 12,67,28,274.88 | ₹ 29,54,59,549.05 |
| E | 100% | 0% | 19.96958333% | 11996958.33 | 9.330559699% | 2.140234239 | ₹ 2,48,51,679.98 | ₹ 6,17,60,599.80 | ₹ 15,34,85,466.17 | ₹ 38,14,37,168.73 |
Conclusion:
The analysis of US quant and traditional fund performance between 2019 and 2024 indicates a notable advantage for quant funds in terms of risk-adjusted returns, as summarized in Table 2. The simulation for the Indian market further suggests the potential benefits of incorporating quant strategies into retail investors’ portfolios, as detailed in Table 4. Moreover, the projected investment values under different allocation scenarios, presented in Table 5 and further elaborated in tables from Table 11 to Table 21, suggest that portfolios with a higher allocation to quant funds may have the potential for greater growth. The long-term forecasts in Table 22 also support this trend. However, significant barriers to adoption persist in India. Addressing these challenges by drawing lessons from international solutions focused on education, technology, regulation, and transparency will be crucial for enabling wider participation in quantitative investing within the Indian market.
Works Sited
- The Rise of Quantitative Investing in India: Opportunities, Challenges, and Future Prospects in 2024 – Daanik, accessed on May 1, 2025
- Exploring Quantitative Trading: Challenges, Benefits & Future Prospects – Equirus Wealth, accessed on May 1, 2025
- Why Quant Funds are Gaining Popularity in India: Unraveling the Rise of Algorithmic Investing – Wright Research, accessed on May 1, 2025,
- Why quantitative investing is the next big thing in India’s fintech ecosystem, accessed on May 1, 2025
- Bull and bear markets over time – Vanguard, accessed on May 1, 2025,
- S&P 500 Historical Trends | Guggenheim Investments, accessed on May 1, 2025,
- 5 charts that put market volatility in perspective | Capital Group, accessed on May 1, 2025,
- Risk Perception of Retail Investors towards Equity Investment in indian stock market – IJFANS International Journal of Food and Nutritional Sciences, accessed on May 1, 2025,
- Guide to Quant Investing 7: Risks of Quantitative Investing – Wright Research, accessed on May 1, 2025,
- What is Quantitative Trading? What are the Advantages and Disadvantages?, accessed on May 1, 2025,
- Sebi opens algorithmic trading to retail investors: Opportunities, risks, and the future of HFT in India – The Economic Times, accessed on May 1, 2025,
- A serial mediation model for investigating the intention to use algorithmic trading platforms among retail investors in India | Emerald Insight, accessed on May 1, 2025,
- Quant strategies in India: A 360-degree view and road ahead – PMS BAZAAR, accessed on May 1, 2025,
- What’s wrong with Quant small cap fund : r/mutualfunds – Reddit, accessed on May 1, 2025,
- Our call on Quant AMC funds: Has it changed now? – PrimeInvestor, accessed on May 1, 2025,
- Quant is struggling : r/mutualfunds – Reddit, accessed on May 1, 2025,
- Stock Market Crash: Quant MF’s Sandeep Tandon Agrees Large caps Will Recover First, But Says… – YouTube, accessed on May 1, 2025,
- Improving financial literacy of new retail investors for a better support in their investment decision-making process, accessed on May 1, 2025,
- The mutual funds route to Viksit Bharat @2047 – PwC India, accessed on May 1, 2025,
- Best Quant Algo Trading Software: Review – ESG | The Report, accessed on May 1, 2025,
- Great Quantitative Trading Platforms in 2024 – Composer.trade, accessed on May 1, 2025,
- QuantConnect.com: Open Source Algorithmic Trading Platform., accessed on May 1, 2025,
- Algorithmic Trading and Challenges on Retail Investors in Emerging Markets, accessed on May 1, 2025,
- What the future holds for quant investing: Ten hypotheses | Robeco Global, accessed on May 1, 2025,
- The art of quant investing | Robeco UK, accessed on May 1, 2025,
- Singapore Retail Market Analysis Report 2025: Market to Grow by a CAGR of 3.00″>> 3.00 to 2033, Driven by Government Incentives, Popularity of Virtual Assistants, and Strategic Partnerships, accessed on May 1, 2025,
- 2024 Investment Climate Statements: Singapore – State Department, accessed on May 1, 2025,
- Incentives for Doing Business in Singapore – ASEAN Briefing, accessed on May 1, 2025,
- Singapore Incentives and Schemes to Attract Industry 4.0 Investments – ASEAN Briefing, accessed on May 1, 2025,
- Will Big Data Be Increasingly Fundamental to Stock Picking? – Morgan Stanley, accessed on May 1, 2025,
- Future of Quantitative Investing – Machine Learning, AI, Quantum Computing & More, accessed on May 1, 2025,
- AI and quant investing | Pictet Asset Management Singapore, accessed on May 1, 2025,
- An evolution of quantitative investing | Institutional Investor | Macquarie Asset Management, accessed on May 1, 2025,
💬 Join Our WhatsApp Channel
Be the first to get investment learning insights, exclusive updates about FidelFolio research, products, and reports, and instant notifications about upcoming webinars. Join our WhatsApp channel and never miss an opportunity to stay informed.
Join WhatsApp Channel