Great Himalayan Compounder Fund
Outperforming the market doesn’t have to be guesswork. FidelFolio Great Himalayan Compounder Fund is a data-driven, fixed-fee portfolio designed to deliver long-term compounding with lower downside and no hidden costs.
- Start with just ₹4,00,000
- Invest in a minutes
- Built on 25+ years of backtested data
- 3 lakhs+ investment rules created
Return Characteristics
Statistical analysis of backtested rolling return from 2000 to 2025
The Great Himalayan Compounder strategy has demonstrated consistent and reliable outperformance across a decade.
Compared to Nifty 50’s 15% CAGR, the portfolio averaged 21%, with nearly zero downside risk over any rolling 3-year period.
Its Sortino Ratio of 38.1 reflects best-in-class risk-adjusted returns — and 75% of 3-year periods delivered >15% gains.
Built for long-term compounding, this strategy shines in both bull and bear markets.
| Metric | Great Himalayan Compounder | Nifty 50 |
|---|---|---|
| Mean (3Yr CAGR) | 21% | 15% |
| Median (3Yr CAGR) | 20% | 13% |
| Downside Risk (MAR < 0%) (3Yr CAGR) | 0.2 | 2 |
| Sortino Ratio | 38.1 | 5.1 |
| Probability of 15%+ Returns (3Yr CAGR) | 75% | 38% |
| Average CY Returns (FY14–24) | 17% | 14% |
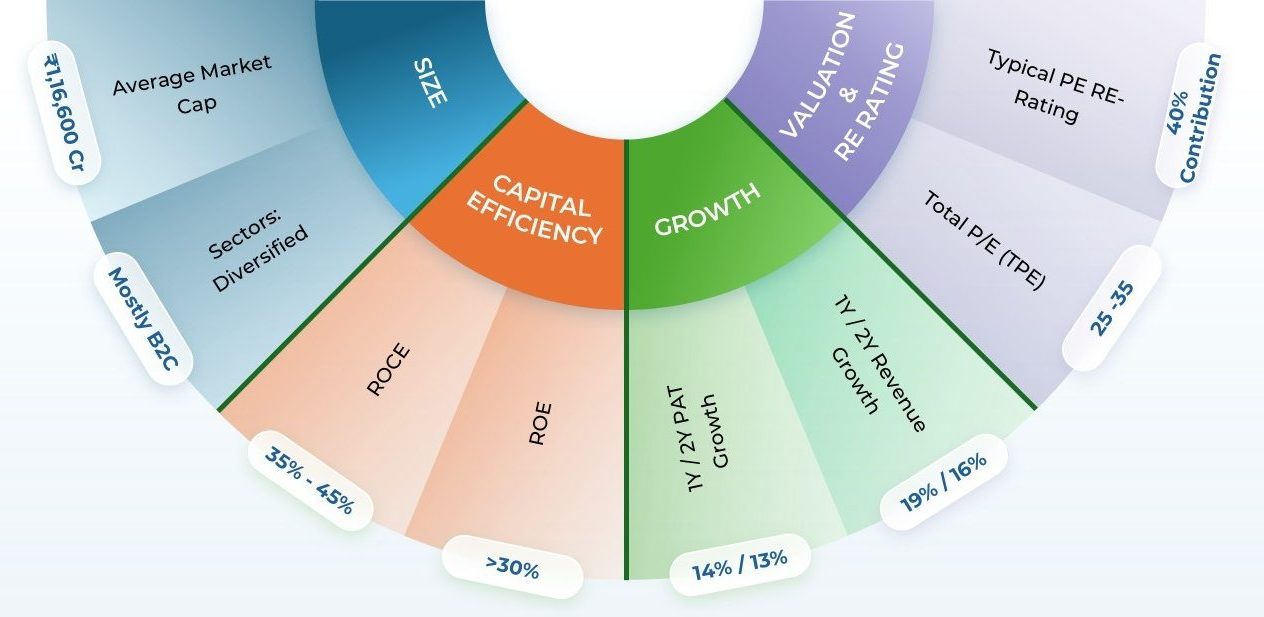
Business Quality Snapshot
What Defines the Fidelfolio Portfolio
The companies in Fidelfolio’s portfolio consistently deliver high profitability and steady earnings growth.
With mid-30s to 40s ROCE/ROE, PAT and revenue CAGR in the mid-teens, and an average PE in the mid-20s to 30s range — these firms are both efficient and growth-focused.
Roughly 40% of returns have historically come from valuation re-rating, rewarding quality.
The strategy emphasizes strong fundamentals while focusing on established mid to large-cap companies.
What Makes FidelFolio Different
Discover how FidelFolio empowers investors with transparent, data-driven investment strategies grounded in 25+ years of historical analysis.
Introducing MAGIC 2.0 – AI for Smarter Investing
Our proprietary AI-ML engine, MAGIC 2.0, tests and combines over 3 lakh investment rules, leveraging decades of financial data to surface the most reliable strategies.
- 20 elite rules powering the Large Cap Dream Funds
- High-return strategies with low downside risk
- Fully transparent fixed-fee structure
Why Trust FidelFolio
At FidelFolio, we prioritize transparency, credibility, and investor-first principles to build confidence and long-term wealth.
We’re not just building portfolios. We’re building investor confidence.
Check out our PortfolioFrequently Asked Questions
At FidelFolio, we follow a quantitative long-term investing approach based on fundamental analysis. Over long-term, company’s business fundamentals determine investment outcomes. Read more about our Investment process.
₹4,00,000 via your own Smallcase account.
Typically once a quarter or when required, with a long-term perspective.
An AUM (Assets Under Management) based fee. No hidden charges, no commissions.
No. It’s a rule-based portfolio managed via your Smallcase account. You keep full control of your investments.
The Market Reward Discipline. Not Guesswork
If you’re ready to leave behind high fees, emotion-driven investing, and inconsistent returns, it’s time to upgrade.
💬 Join Our WhatsApp Channel
Be the first to get investment learning insights, exclusive updates about FidelFolio research, products, and reports, and instant notifications about upcoming webinars. Join our WhatsApp channel and never miss an opportunity to stay informed.
Join WhatsApp Channel