Research made investible
5 strategies from 2 research frameworks
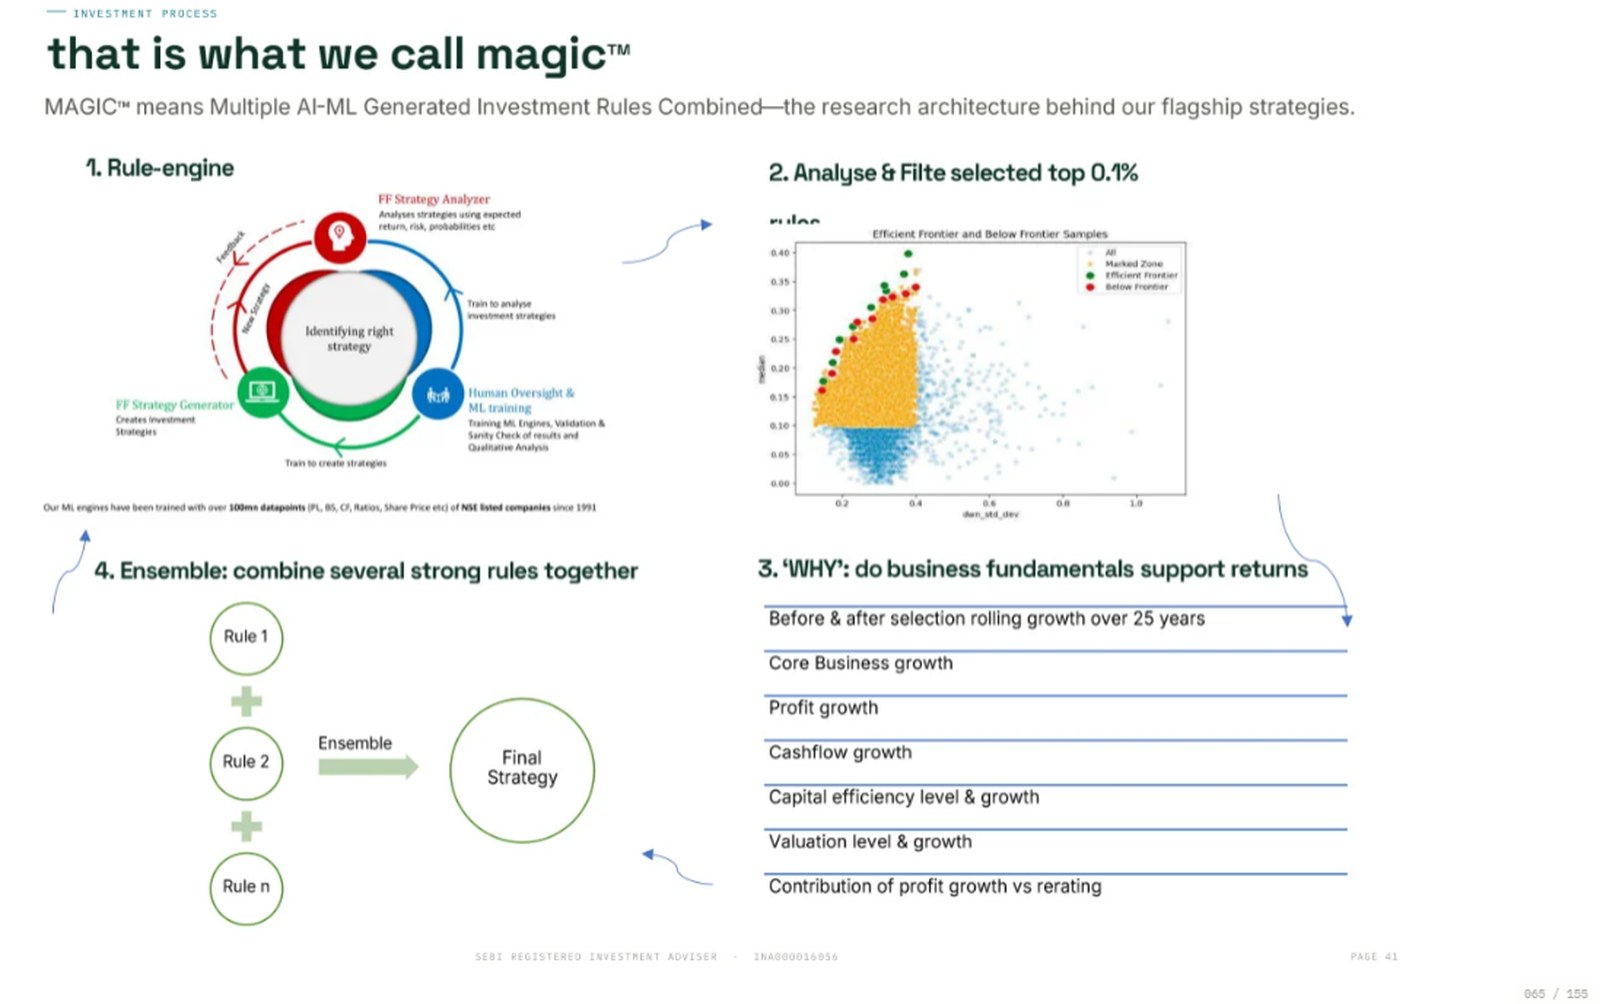
MAGIC studies human-understandable investment rules across decades of market history and millions of financial observations.
Neuro uses explainable deep learning to identify long-term changes in companies that may not yet be fully reflected in their market value.
- Shivalik EquityEstablished, profitable businesses selected with valuation discipline
- Everest EquityFidelFolio’s broadest combination of tested fundamental investment signals
- Kangchenjunga EquityBusinesses improving profitability, supported by cash conversion and valuation discipline
- K2 EquityBusinesses where earnings growth and profitability improvement are accelerating together
- Neuro EquityCompanies identified through machine learning using patterns in long-term business fundamentals.
Low-ticket, low-cost access to flagship: Everest Equity Access & K2 Equity Access.
Partner-customised mandate: a non-violence values-aligned equity strategy built using the MAGIC framework — Sinless Equity.
FidelFolio Investments is a SEBI-registered Investment Adviser (INA000016056). Strategy risk and return information is validated under SEBI’s Performance Validation Agency (PaRRVA) framework; verified performance is published for the validated period only.

find the strategy that fits your journey…
ReturnRiskRisk and return positions on this map are indicative of relative placement within FidelFolio’s equity range. They are not drawn to scale and are not a forecast of returns.
The role each strategy is designed to play
Loading table…
Shivalik Equity
Established, profitable businesses selected with valuation discipline
Shivalik Equity seeks companies that already demonstrate strong profitability and capital efficiency while remaining reasonably valued. It combines two related profitability-and-valuation rule families to create a diversified portfolio positioned at the relatively lower-risk end of FidelFolio’s equity range.
- Framework
- MAGIC
- Category
- Diversified quality–value equity
- Role
- Relatively lower-risk core allocation
- Access
- AUM-linked advisory
- Horizon
- 5 years or longer
- Benchmark
- Nifty 50
- Live since
- October 2022
- Relative risk
- Relatively lower within the FidelFolio equity range

Shivalik Equity
Capital market pattern
Companies that successfully scale can generate both earnings growth and substantial changes in market expectations. This is the pattern Shivalik Equity is built to capture
Combines two related rule families that identify profitable businesses available at disciplined valuations.
- Established profitability
- Strong capital efficiency
- Valuation discipline
- Financial quality sustained over time
- Sustainability of profitability
- Future earnings and cash-flow growth
- Valuation evolution
- Long-term return and downside behaviour
Investment process of Shivalik Equity
Backtested return metrics of Shivalik Equity
Rolling returns, alpha, downside risk and probability outcomes across the full test period
Loading table…
Backtested fundamental metrics of Shivalik Equity
Business fundamentals before and after companies entered the historical portfolio
Loading table…
Live return metrics of Shivalik Equity
Realised rolling outcomes since October 2022, reviewed against the broad historical distribution
Unlock live performance and returns of FidelFolio products
Verified figures are published for the validated period only, and are shown alongside consistency and downside behaviour rather than a single headline return. Shivalik Equity has been live since October 2022, while independently verified performance under the PaRRVA framework is available from April 2026. Performance for the period before validation can be shared with you individually, on request, in the manner permitted under SEBI guidelines.
See whether the strategy is progressing as expected
Live outcomes are compared with the broad historical range rather than one fixed return expectation
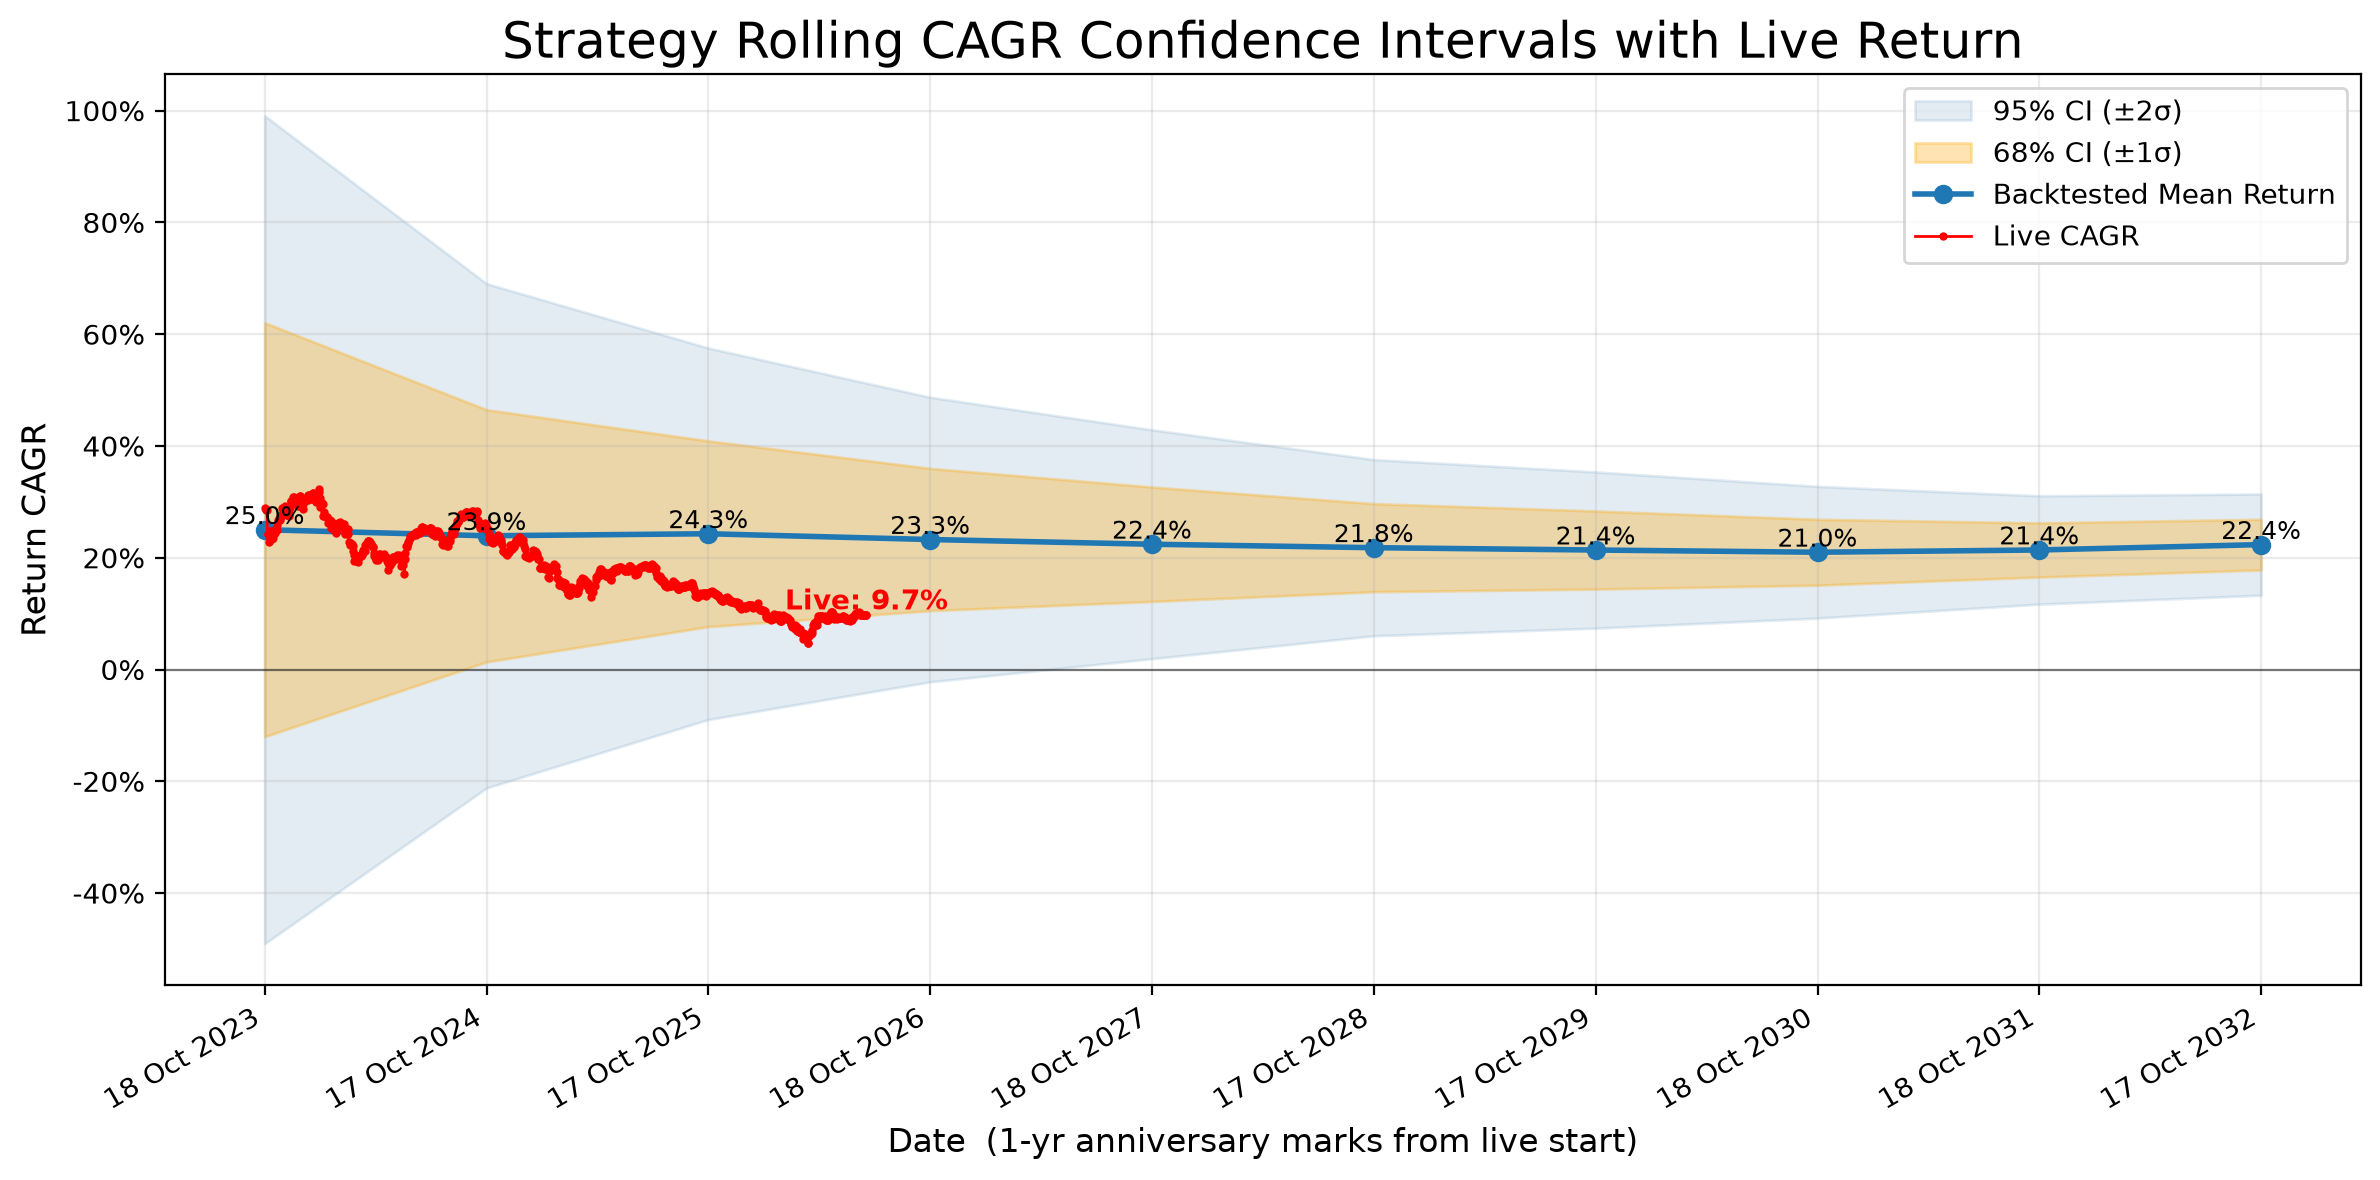
Live outcomes are compared with the broad historical range rather than one fixed return expectation.
How Shivalik Equity may behave
Risk is stated before access, not after it
| Expected volatility relative to benchmark | Broadly in line with, or below, the broad-market benchmark |
|---|---|
| Worst rolling 1-year return observed (backtest) | -49.2% |
| Probability of loss (rolling 1-year periods) | 17.2% of rolling observations |
| Recommended horizon | 5 years or longer |
| Who should not invest | Investors needing capital within 3 years, or unable to remain invested through an equity-market correction |
Shivalik Equity occupies the relatively lower-risk end of FidelFolio’s equity range, but it remains an equity strategy and can experience market declines and periods of underperformance. Its emphasis on established profitability and valuation discipline is intended to provide a more resilient long-term investment experience.
Its relatively measured risk profile seeks to preserve meaningful long-term wealth-creation potential without moving to the aggressive end of the equity spectrum.The strategies are designed for long-term investing. Temporary volatility or underperformance does not necessarily indicate that the underlying investment hypothesis has failed. Strategy selection should nevertheless reflect each investor’s horizon, financial circumstances and ability to tolerate equity-market fluctuations.
Invest in Shivalik Equity
Subscribe and invest through the smallcase platform, after risk profiling and a suitability assessment
Every strategy is available through the smallcase platform after risk profiling and a suitability assessment.
- Access
- AUM-linked advisory
- Fee mode
- AUM-linked advisory
- Minimum horizon
- 5 years or longer
- Live since
- October 2022
Advisory fee is charged on the assets advised, billed periodically as set out in the advisory agreement.
Fees, billing frequency, minimum investment and refund treatment are disclosed in full before onboarding. Investments in securities markets are subject to market risks; read all related documents carefully before investing.
See the research beneath the strategy
Every strategy connects back to the research library, the learning centre and the compliance record
Methodology, product notes, factsheets, research papers and the live performance record behind every strategy.
- Methodology
- Product notes & factsheets
- Research papers
- White papers
- Live performance
- Webinars & videos
Guided series on rules-based investing, rolling returns, downside behaviour and investor behaviour.
- Rules-based investing
- Reading rolling returns
- Understanding drawdowns
- Behaviour and horizon
- Using the backtesting tool
Regulatory status, the investor charter, complaint disclosure and the risks to understand before investing in Shivalik Equity.
Everest Equity
FidelFolio’s broadest combination of tested fundamental investment signals
Everest Equity is FidelFolio’s flagship multi-signal strategy. It brings together qualified, non-redundant rules across profitability, earnings growth, cash flows, balance-sheet strength and valuation, creating a diversified core portfolio that is not dependent on any single investment pattern.
- Framework
- MAGIC
- Category
- Diversified multi-signal equity
- Role
- Flagship core allocation
- Access
- AUM-linked advisory; fixed-fee retail alternative available in the same risk zone
- Horizon
- 5 years or longer
- Benchmark
- Nifty 50
- Live since
- March 2023
- Relative risk
- Moderate

Everest Equity
Capital market pattern
Companies that successfully scale can generate both earnings growth and substantial changes in market expectations. This is the pattern Everest Equity is built to capture
Combines FidelFolio’s qualified, non-redundant fundamental rules into a broad multi-signal portfolio.
- Profitability and capital efficiency
- Earnings and operating growth
- Cash conversion and cash-flow strength
- Balance-sheet quality
- Valuation
- Fundamental growth across multiple dimensions
- Resilience across different market cycles
- Return consistency
- Downside and risk-adjusted outcomes
Investment process of Everest Equity
Backtested return metrics of Everest Equity
Rolling returns, alpha, downside risk and probability outcomes across the full test period
Loading table…
Backtested fundamental metrics of Everest Equity
Business fundamentals before and after companies entered the historical portfolio
Loading table…
Live return metrics of Everest Equity
Realised rolling outcomes since March 2023, reviewed against the broad historical distribution
Unlock live performance and returns of FidelFolio products
Verified figures are published for the validated period only, and are shown alongside consistency and downside behaviour rather than a single headline return. Everest Equity has been live since March 2023, while independently verified performance under the PaRRVA framework is available from April 2026. Performance for the period before validation can be shared with you individually, on request, in the manner permitted under SEBI guidelines.
See whether the strategy is progressing as expected
Live outcomes are compared with the broad historical range rather than one fixed return expectation
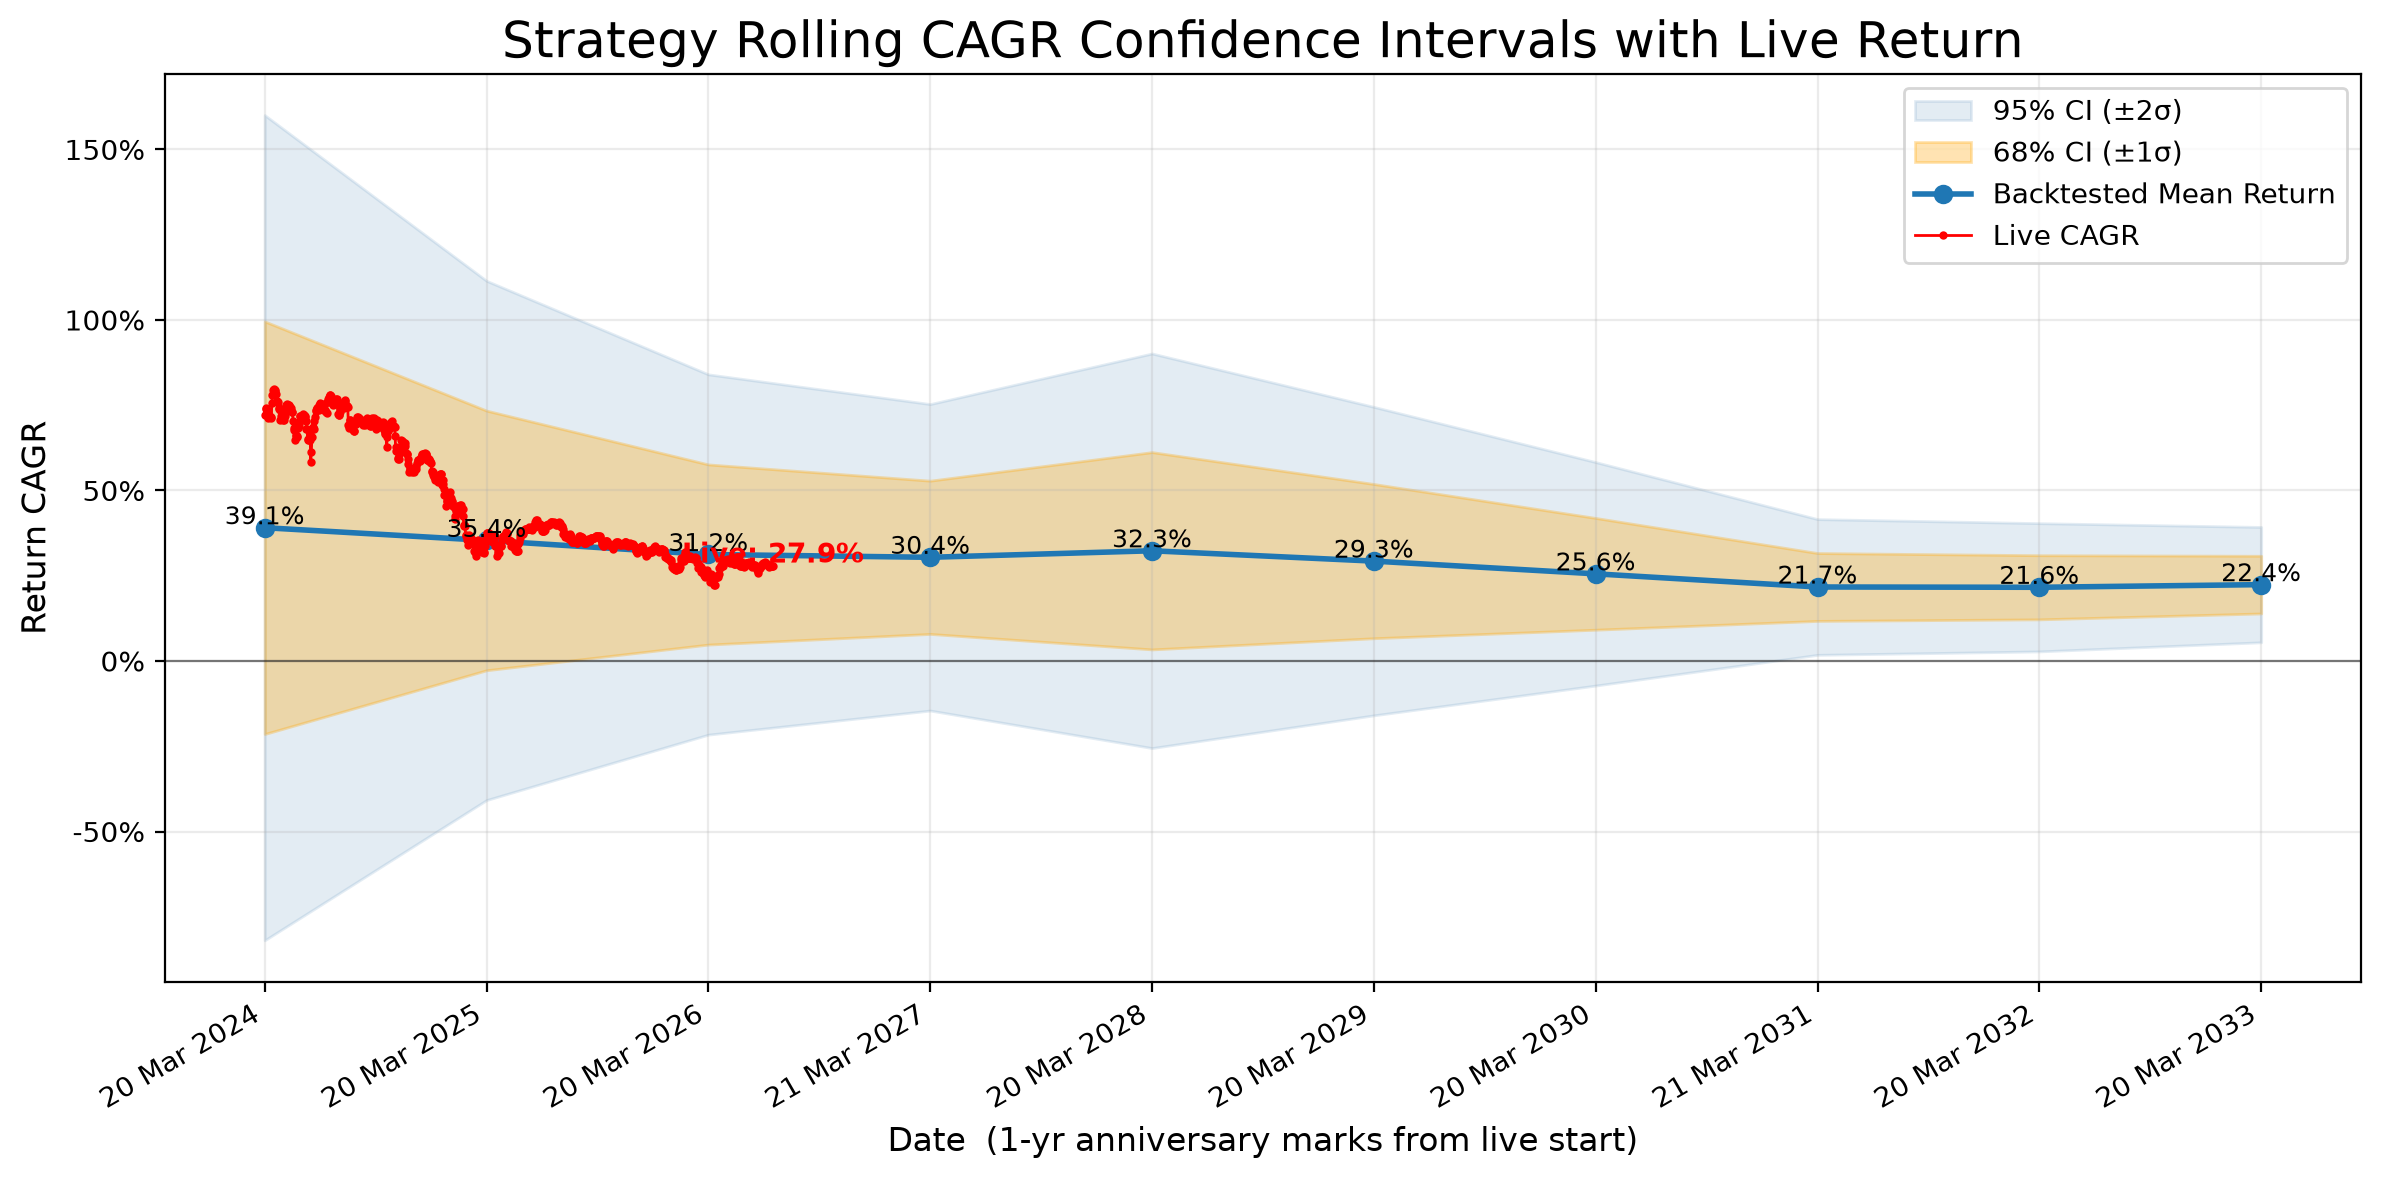
Live outcomes are compared with the broad historical range rather than one fixed return expectation.
How Everest Equity may behave
Risk is stated before access, not after it
| Expected volatility relative to benchmark | Comparable to the broad-market benchmark across a full cycle |
|---|---|
| Worst rolling 1-year return observed (backtest) | -56.9% |
| Probability of loss (rolling 1-year periods) | 24.4% of rolling observations |
| Recommended horizon | 5 years or longer |
| Who should not invest | Investors expecting every signal to work at once, or judging the portfolio over a single year |
Everest Equity can experience equity-market volatility and temporary underperformance when some of its underlying investment signals are out of favour. Because it combines several fundamental patterns, different parts of the portfolio may contribute at different stages of a market cycle.
Its diversified multi-signal design seeks to create a balanced path to long-term wealth creation without relying on one investment style alone.The strategies are designed for long-term investing. Temporary volatility or underperformance does not necessarily indicate that the underlying investment hypothesis has failed. Strategy selection should nevertheless reflect each investor’s horizon, financial circumstances and ability to tolerate equity-market fluctuations.
Invest in Everest Equity
Subscribe and invest through the smallcase platform, after risk profiling and a suitability assessment
Every strategy is available through the smallcase platform after risk profiling and a suitability assessment.
- Access
- AUM-linked advisory
- Fee mode
- AUM-linked advisory
- Minimum horizon
- 5 years or longer
- Live since
- March 2023
Advisory fee is charged on the assets advised, billed periodically as set out in the advisory agreement.
The low-ticket access strategies carry a fixed subscription fee instead of an assets-linked arrangement.
Open Everest Equity Access (opens in new tab)Fees, billing frequency, minimum investment and refund treatment are disclosed in full before onboarding. Investments in securities markets are subject to market risks; read all related documents carefully before investing.
See the research beneath the strategy
Every strategy connects back to the research library, the learning centre and the compliance record
Methodology, product notes, factsheets, research papers and the live performance record behind every strategy.
- Methodology
- Product notes & factsheets
- Research papers
- White papers
- Live performance
- Webinars & videos
Guided series on rules-based investing, rolling returns, downside behaviour and investor behaviour.
- Rules-based investing
- Reading rolling returns
- Understanding drawdowns
- Behaviour and horizon
- Using the backtesting tool
Regulatory status, the investor charter, complaint disclosure and the risks to understand before investing in Everest Equity.
Kangchenjunga Equity
Businesses improving profitability, supported by cash conversion and valuation discipline
Kangchenjunga Equity seeks businesses showing improving returns on capital and profitability, supported by healthy cash conversion and reasonable valuation. It is intended as a higher-risk allocation for investors seeking stronger long-term wealth-creation potential from improving businesses.
- Framework
- MAGIC
- Category
- Quality-improvement equity
- Role
- Higher-growth allocation
- Access
- AUM-linked advisory; fixed-fee retail alternative available in the same risk zone
- Horizon
- 7 years or longer
- Benchmark
- Nifty Smallcap 250
- Live since
- March 2023
- Relative risk
- Moderately aggressive

Kangchenjunga Equity
Capital market pattern
Companies that successfully scale can generate both earnings growth and substantial changes in market expectations. This is the pattern Kangchenjunga Equity is built to capture
Identifies businesses where improving profitability is supported by cash conversion and valuation discipline.
- Improving ROCE and ROE
- Improving business economics
- Supporting cash-flow conversion
- Reasonable valuation
- Continuation of profitability improvement
- Translation of profits into cash flows
- Earnings and business growth
- Subsequent long-term return outcomes
Investment process of Kangchenjunga Equity
Backtested return metrics of Kangchenjunga Equity
Rolling returns, alpha, downside risk and probability outcomes across the full test period
Loading table…
Backtested fundamental metrics of Kangchenjunga Equity
Business fundamentals before and after companies entered the historical portfolio
Loading table…
Live return metrics of Kangchenjunga Equity
Realised rolling outcomes since March 2023, reviewed against the broad historical distribution
Unlock live performance and returns of FidelFolio products
Verified figures are published for the validated period only, and are shown alongside consistency and downside behaviour rather than a single headline return. Kangchenjunga Equity has been live since March 2023, while independently verified performance under the PaRRVA framework is available from April 2026. Performance for the period before validation can be shared with you individually, on request, in the manner permitted under SEBI guidelines.
See whether the strategy is progressing as expected
Live outcomes are compared with the broad historical range rather than one fixed return expectation
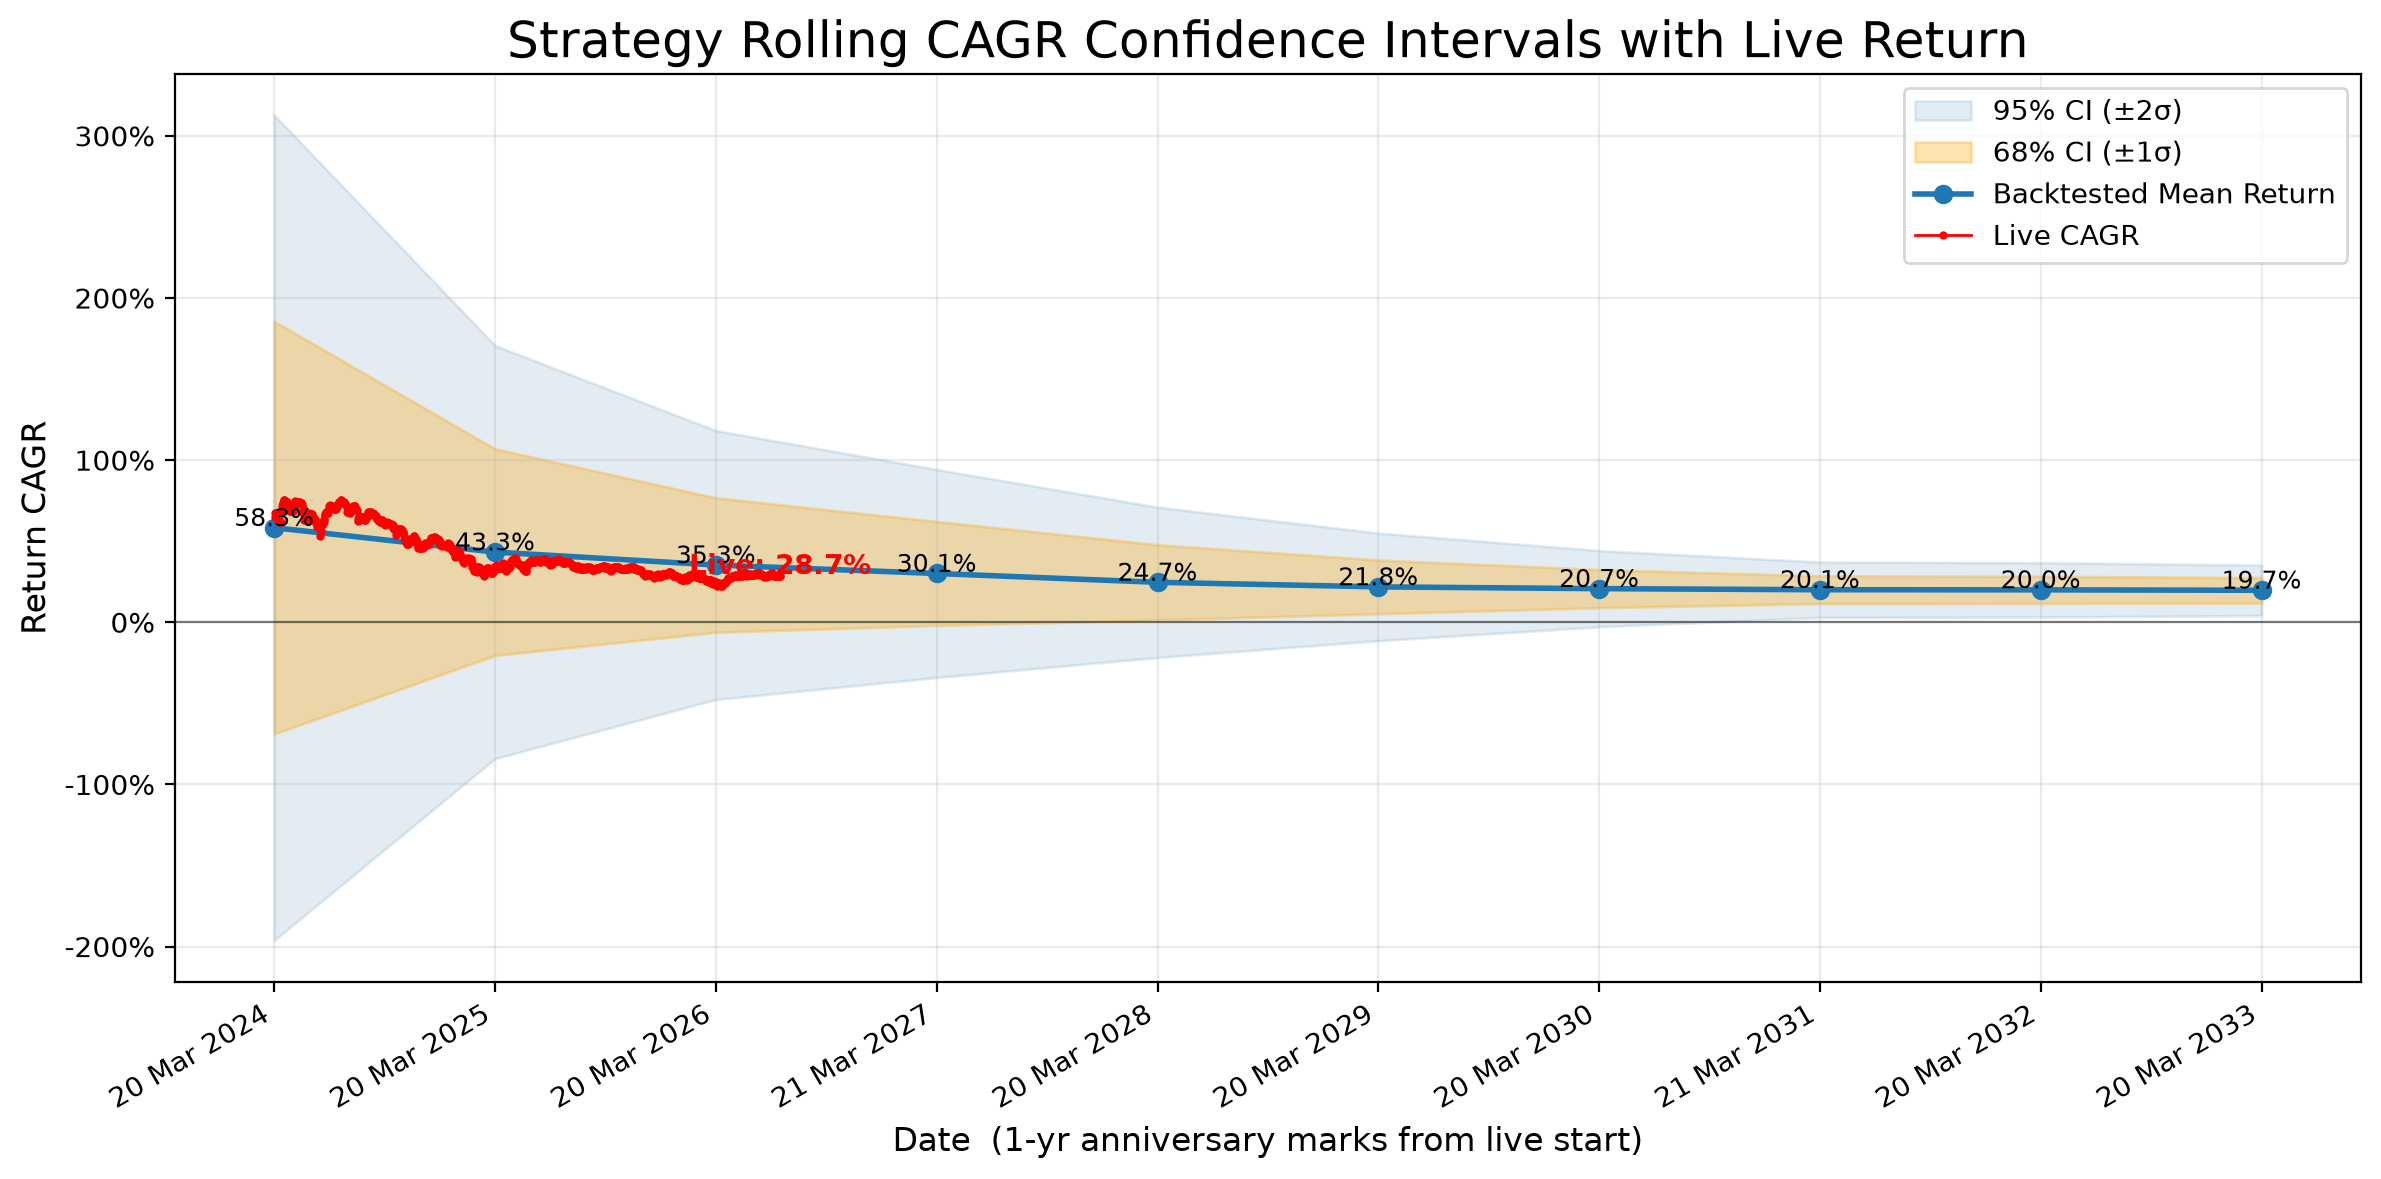
Live outcomes are compared with the broad historical range rather than one fixed return expectation.
How Kangchenjunga Equity may behave
Risk is stated before access, not after it
| Expected volatility relative to benchmark | Higher than the broad-market benchmark |
|---|---|
| Worst rolling 1-year return observed (backtest) | -66.6% |
| Probability of loss (rolling 1-year periods) | 28.0% of rolling observations |
| Recommended horizon | 7 years or longer |
| Who should not invest | Investors uncomfortable with sustained volatility while a business-improvement thesis develops |
Kangchenjunga Equity may experience higher volatility because businesses undergoing fundamental improvement do not always progress smoothly. Profitability improvements may take time to become visible, and some companies may temporarily disappoint market expectations.
This higher variability is accepted in pursuit of greater long-term wealth-creation potential from businesses whose economics are becoming stronger.The strategies are designed for long-term investing. Temporary volatility or underperformance does not necessarily indicate that the underlying investment hypothesis has failed. Strategy selection should nevertheless reflect each investor’s horizon, financial circumstances and ability to tolerate equity-market fluctuations.
Invest in Kangchenjunga Equity
Subscribe and invest through the smallcase platform, after risk profiling and a suitability assessment
Every strategy is available through the smallcase platform after risk profiling and a suitability assessment.
- Access
- AUM-linked advisory
- Fee mode
- AUM-linked advisory
- Minimum horizon
- 7 years or longer
- Live since
- March 2023
Advisory fee is charged on the assets advised, billed periodically as set out in the advisory agreement.
The low-ticket access strategies carry a fixed subscription fee instead of an assets-linked arrangement.
Open K2 Equity Access (opens in new tab)Fees, billing frequency, minimum investment and refund treatment are disclosed in full before onboarding. Investments in securities markets are subject to market risks; read all related documents carefully before investing.
See the research beneath the strategy
Every strategy connects back to the research library, the learning centre and the compliance record
Methodology, product notes, factsheets, research papers and the live performance record behind every strategy.
- Methodology
- Product notes & factsheets
- Research papers
- White papers
- Live performance
- Webinars & videos
Guided series on rules-based investing, rolling returns, downside behaviour and investor behaviour.
- Rules-based investing
- Reading rolling returns
- Understanding drawdowns
- Behaviour and horizon
- Using the backtesting tool
Regulatory status, the investor charter, complaint disclosure and the risks to understand before investing in Kangchenjunga Equity.
K2 Equity
Businesses where earnings growth and profitability improvement are accelerating together
K2 Equity is FidelFolio’s most aggressive MAGIC strategy. It seeks companies displaying strong earnings growth together with improving profitability and capital efficiency, creating the potential for substantial long-term business and market-value expansion.
- Framework
- MAGIC
- Category
- Fundamental-acceleration equity
- Role
- Aggressive long-term allocation
- Access
- AUM-linked advisory
- Horizon
- 7 years or longer
- Benchmark
- Nifty Smallcap 250
- Live since
- February 2024
- Relative risk
- Aggressive

K2 Equity
Capital market pattern
Companies that successfully scale can generate both earnings growth and substantial changes in market expectations. This is the pattern K2 Equity is built to capture
Identifies businesses where earnings growth and profitability improvement are occurring together.
- Accelerating earnings
- Improving profitability
- Strengthening return on capital
- Strong fundamental momentum
- Persistence of earnings acceleration
- Continued improvement in capital efficiency
- Business and market-value expansion
- Higher return dispersion and long-term outcomes
Investment process of K2 Equity
Backtested return metrics of K2 Equity
Rolling returns, alpha, downside risk and probability outcomes across the full test period
Loading table…
Backtested fundamental metrics of K2 Equity
Business fundamentals before and after companies entered the historical portfolio
Loading table…
Live return metrics of K2 Equity
Realised rolling outcomes since February 2024, reviewed against the broad historical distribution
Unlock live performance and returns of FidelFolio products
Verified figures are published for the validated period only, and are shown alongside consistency and downside behaviour rather than a single headline return. K2 Equity has been live since February 2024, while independently verified performance under the PaRRVA framework is available from April 2026. Performance for the period before validation can be shared with you individually, on request, in the manner permitted under SEBI guidelines.
See whether the strategy is progressing as expected
Live outcomes are compared with the broad historical range rather than one fixed return expectation
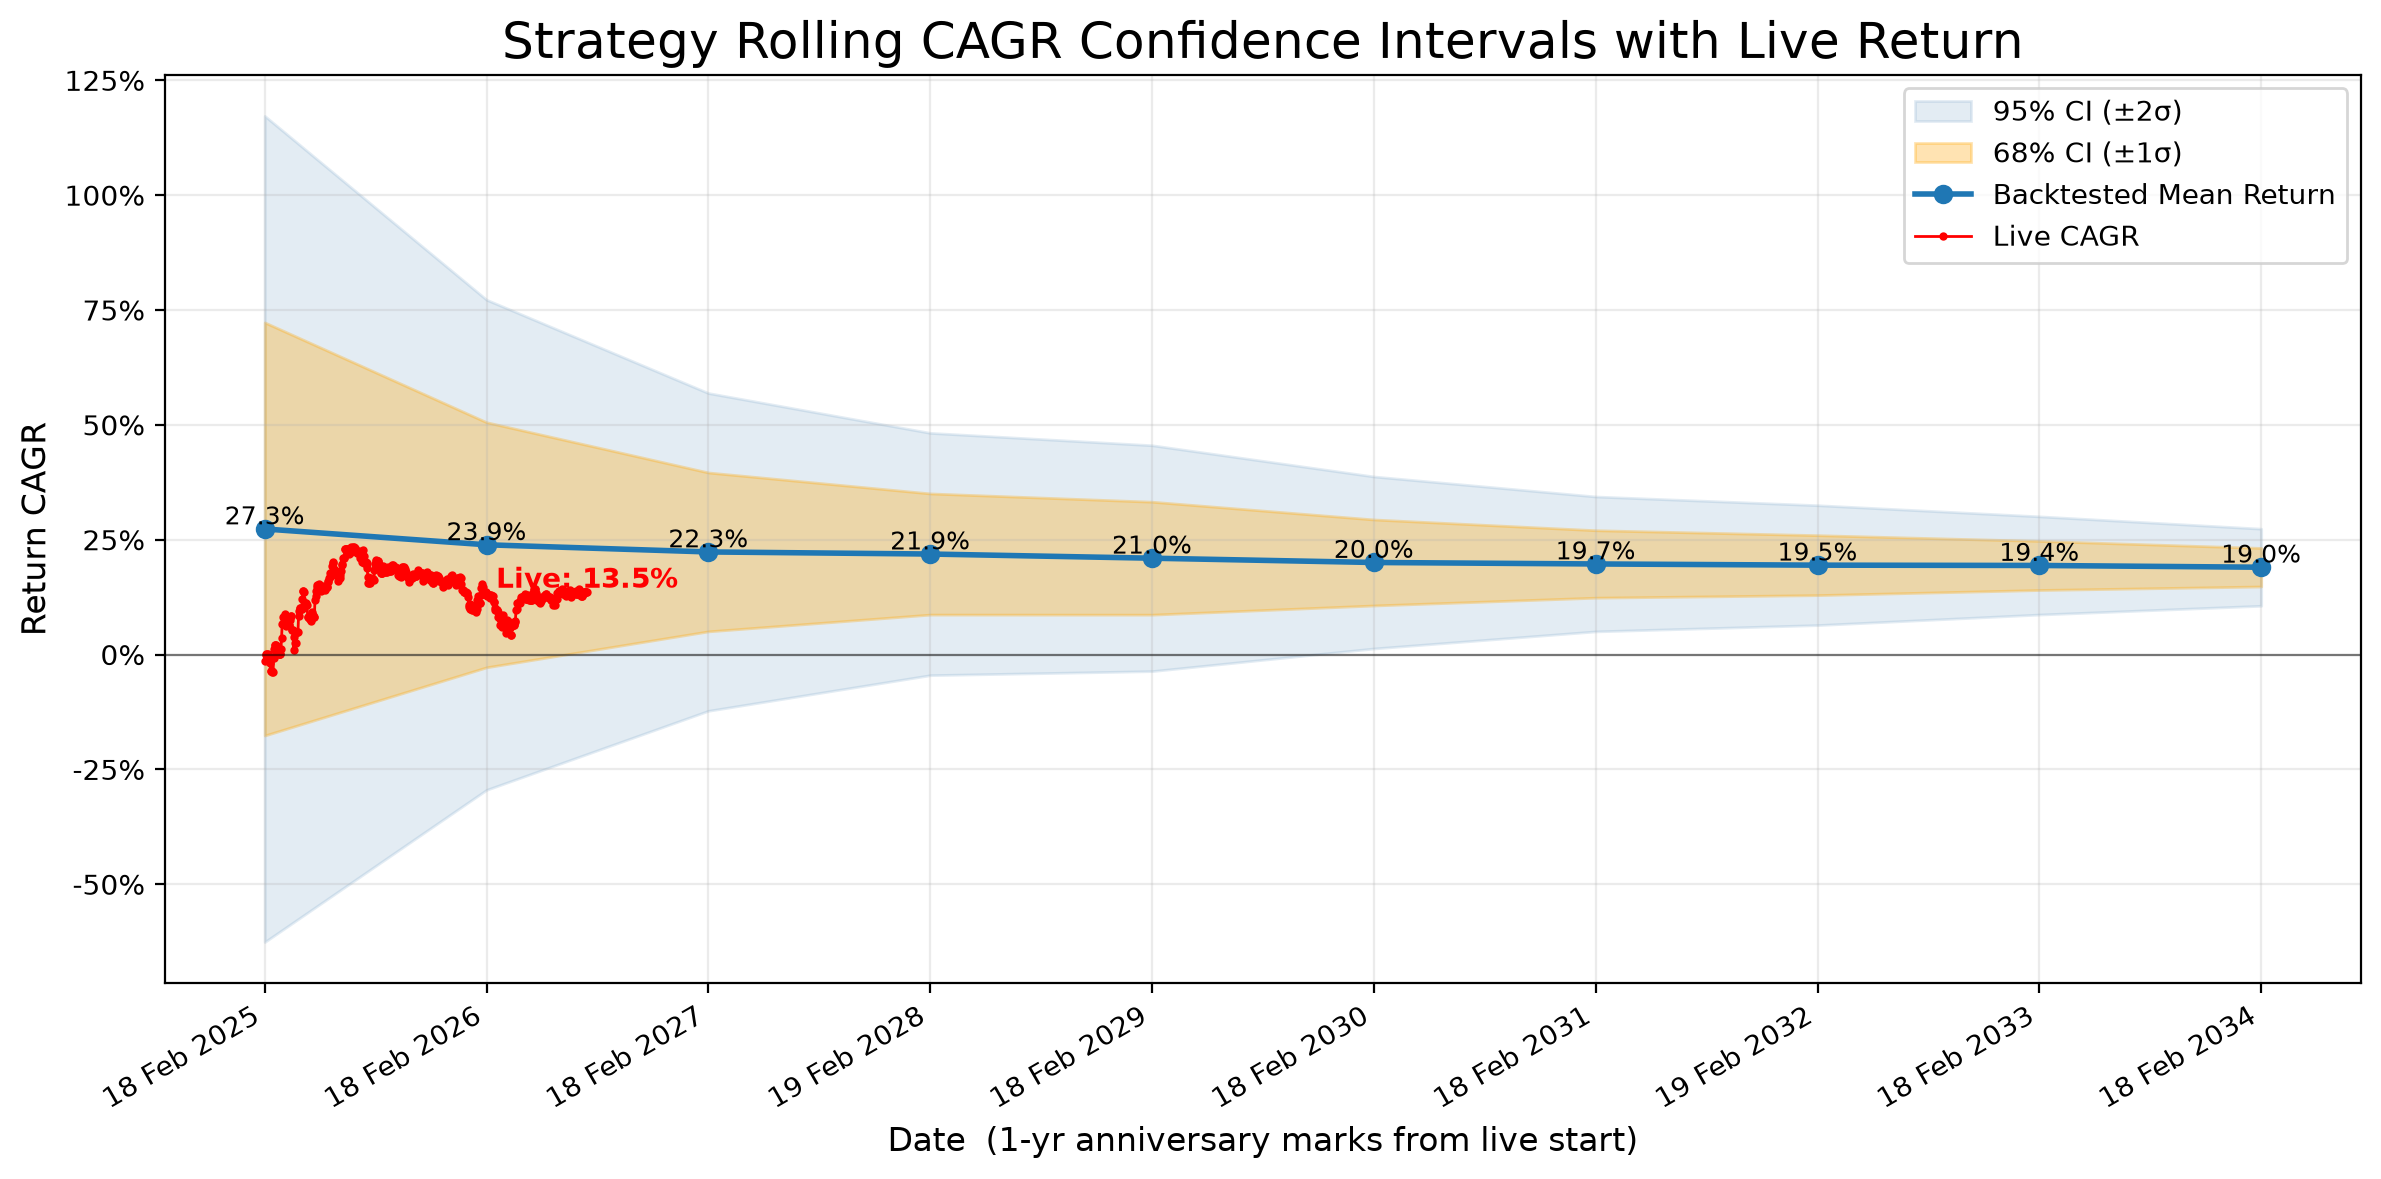
Live outcomes are compared with the broad historical range rather than one fixed return expectation.
How K2 Equity may behave
Risk is stated before access, not after it
| Expected volatility relative to benchmark | Materially higher than the broad-market benchmark |
|---|---|
| Worst rolling 1-year return observed (backtest) | -72.3% |
| Probability of loss (rolling 1-year periods) | 27.8% of rolling observations |
| Recommended horizon | 7 years or longer |
| Who should not invest | Investors who react to short-term performance extremes, or who cannot tolerate sharp drawdowns |
K2 Equity can experience sharp fluctuations and meaningful periods of underperformance because accelerating-growth companies are often more sensitive to changes in expectations, valuations and business momentum. It is intended for investors with a long horizon and a strong ability to remain invested through market cycles.
Its aggressive profile seeks greater long-term wealth-creation potential from fundamental acceleration, although higher risk does not assure higher returns.The strategies are designed for long-term investing. Temporary volatility or underperformance does not necessarily indicate that the underlying investment hypothesis has failed. Strategy selection should nevertheless reflect each investor’s horizon, financial circumstances and ability to tolerate equity-market fluctuations.
Invest in K2 Equity
Subscribe and invest through the smallcase platform, after risk profiling and a suitability assessment
Every strategy is available through the smallcase platform after risk profiling and a suitability assessment.
- Access
- AUM-linked advisory
- Fee mode
- AUM-linked advisory
- Minimum horizon
- 7 years or longer
- Live since
- February 2024
Advisory fee is charged on the assets advised, billed periodically as set out in the advisory agreement.
Fees, billing frequency, minimum investment and refund treatment are disclosed in full before onboarding. Investments in securities markets are subject to market risks; read all related documents carefully before investing.
See the research beneath the strategy
Every strategy connects back to the research library, the learning centre and the compliance record
Methodology, product notes, factsheets, research papers and the live performance record behind every strategy.
- Methodology
- Product notes & factsheets
- Research papers
- White papers
- Live performance
- Webinars & videos
Guided series on rules-based investing, rolling returns, downside behaviour and investor behaviour.
- Rules-based investing
- Reading rolling returns
- Understanding drawdowns
- Behaviour and horizon
- Using the backtesting tool
Regulatory status, the investor charter, complaint disclosure and the risks to understand before investing in K2 Equity.
Neuro Equity
Machine learning applied to long-term company fundamentals
Neuro Equity uses an explainable machine-learning framework to study the relationship between companies’ historical fundamentals and their subsequent business and market-cap growth. It provides a distinct model-driven approach alongside FidelFolio’s human-understandable MAGIC strategies.
- Framework
- Machine learning
- Category
- Machine-learning equity
- Role
- Alternative research-framework allocation
- Access
- AUM-linked advisory
- Horizon
- 7 years or longer
- Benchmark
- Nifty Smallcap 250
- Live since
- September 2025
- Relative risk
- Aggressive
Neuro Equity
Capital market pattern
Companies that successfully scale can generate both earnings growth and substantial changes in market expectations. This is the pattern Neuro Equity is built to capture
Learns historical relationships between point-in-time company fundamentals and subsequent business and market-cap growth.
- Profitability
- Growth
- Cash flows
- Leverage and balance-sheet structure
- Valuation and other fundamental indicators
- Realised business growth
- Future profitability and financial health
- Market-cap growth
- Live outcomes compared with model expectations
Investment process of Neuro Equity
Features are created from reported fundamentals, models are trained and validated out of sample, and the surviving models are combined — then backtested, fundamentally validated and monitored exactly as a MAGIC strategy is.
Backtested return metrics of Neuro Equity
Rolling returns, alpha, downside risk and probability outcomes across the full test period
Loading table…
Backtested fundamental metrics of Neuro Equity
Business fundamentals before and after companies entered the historical portfolio
Loading table…
How Neuro Equity may behave
Risk is stated before access, not after it
| Expected volatility relative to benchmark | Higher than the broad-market benchmark; model-driven and regime-dependent |
|---|---|
| Worst rolling 1-year return observed (backtest) | -68.9% |
| Probability of loss (rolling 1-year periods) | 24.2% of rolling observations |
| Recommended horizon | 7 years or longer |
| Who should not invest | Investors who need holdings to resemble familiar indices, or who cannot accept model-driven divergence |
Neuro Equity may select companies that differ meaningfully from familiar indices, popular market narratives or conventional investment styles. The machine-learning relationships it uses can perform differently across market environments, leading to periods of divergence from benchmarks and the MAGIC strategies.
Its distinct model-driven approach provides an additional path to long-term wealth creation and diversification across research frameworks.The strategies are designed for long-term investing. Temporary volatility or underperformance does not necessarily indicate that the underlying investment hypothesis has failed. Strategy selection should nevertheless reflect each investor’s horizon, financial circumstances and ability to tolerate equity-market fluctuations.
Invest in Neuro Equity
Subscribe and invest through the smallcase platform, after risk profiling and a suitability assessment
Every strategy is available through the smallcase platform after risk profiling and a suitability assessment.
- Access
- AUM-linked advisory
- Fee mode
- AUM-linked advisory
- Minimum horizon
- 7 years or longer
- Live since
- September 2025
Advisory fee is charged on the assets advised, billed periodically as set out in the advisory agreement.
Fees, billing frequency, minimum investment and refund treatment are disclosed in full before onboarding. Investments in securities markets are subject to market risks; read all related documents carefully before investing.
See the research beneath the strategy
Every strategy connects back to the research library, the learning centre and the compliance record
Methodology, product notes, factsheets, research papers and the live performance record behind every strategy.
- Methodology
- Product notes & factsheets
- Research papers
- White papers
- Live performance
- Webinars & videos
Guided series on rules-based investing, rolling returns, downside behaviour and investor behaviour.
- Rules-based investing
- Reading rolling returns
- Understanding drawdowns
- Behaviour and horizon
- Using the backtesting tool
Regulatory status, the investor charter, complaint disclosure and the risks to understand before investing in Neuro Equity.
Low-cost, low-ticket access to the flagship research
Standardised implementations of the flagship strategies, offered at a low ticket size for a fixed subscription fee rather than an assets-linked arrangement
The same multi-signal MAGIC research, delivered as a standardised portfolio at a low ticket size.
- Everest Equity rule family
- Standardised portfolio
- Fixed subscription fee
The same fundamental-acceleration research, delivered as a standardised portfolio at a low ticket size.
- MAGIC acceleration rule family
- Standardised portfolio
- Fixed subscription fee
The same research and the same rules as the flagship strategies. What differs is the access format: a standardised portfolio, delivered at a low ticket size for a fixed subscription fee.
Research adapted to a defined mandate
Our systematic framework can be applied to well-defined partner requirements — a customised investment universe, without relaxing process discipline
Partner-customised quant mandate on the values of non-violence
The same systematic research framework, applied to a partner-defined investment universe without relaxing process discipline.
- Partner-defined universe
- Unchanged rule discipline
- Distributed by the partner
Available only through the relevant distribution partner.