Little Orion Equity Fund
Outperforming the market doesn’t have to be guesswork. FidelFolio quant small cap fund direct growth is a data-driven, fixed-fee portfolio designed to deliver long-term compounding with lower downside and no hidden costs.
- Start with just ₹1,80,000
- Invest in a minutes
- Built on 25+ years of backtested data
- 3 lakhs+ investment rules created
Return Characteristics
Statistical analysis of backtested rolling return from 2000 to 2025
The Little Orion portfolio has consistently outperformed the Nifty 50 across both short- and long-term horizons. Over the past 3 years, it has delivered an average CAGR of ~29% compared to Nifty’s ~14%, with a median return of 27% — highlighting its broad-based consistency.
Even over shorter periods, its edge remains strong: the 1-year CAGR averaged 34% (median: 31%) vs Nifty’s 12%, showcasing its ability to generate alpha in dynamic market conditions.
Risk metrics reinforce its strength — a lower downside risk of 4% (vs Nifty’s 5%) and a Sortino Ratio of 5.9, far exceeding Nifty’s 1.3, underline its exceptional risk-adjusted returns.
Notably, 72% of rolling 3-year periods have delivered >15% annualized returns, nearly twice the rate seen with the benchmark. Over FY14–24, the portfolio has averaged an impressive ~31% annually — making it a standout long-term wealth compounding strategy.
| Metric | Little Orion Equity | Nifty 50 |
|---|---|---|
| Mean (3Yr CAGR) | 29% | 14% |
| Mean (1Yr CAGR) | 34% | 12% |
| Median (3Yr CAGR) | 27% | 12% |
| Median (1Yr CAGR) | 31% | 12% |
| Downside Risk (MAR < 0%) (3Yr CAGR) | 5.9 | 5 |
| Sortino Ratio | 5.3 | 1.3 |
| Probability of 15%+ Returns (3Yr CAGR) | 72% | 37% |
| Average CY Returns (FY14–24) | 31% | 13.7% |
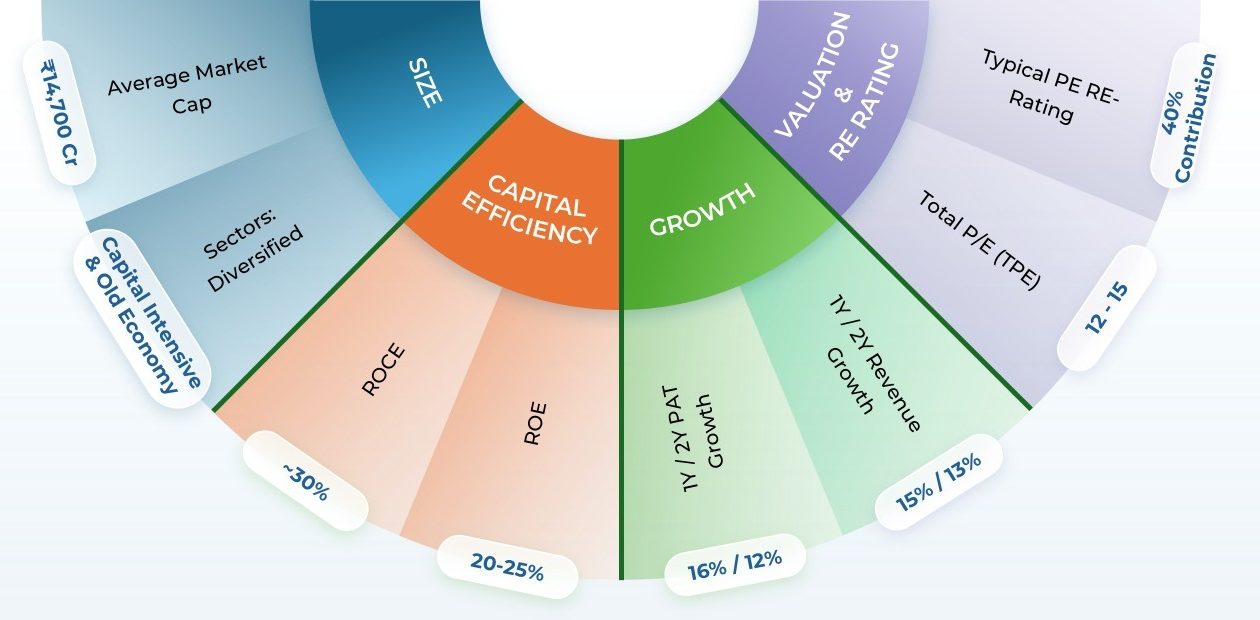
Business Quality Snapshot
What Defines the Fidelfolio Portfolio
The Fidelfolio portfolio is built on strong fundamentals, led by companies with ~30% ROCE and 20–25% ROE, signaling healthy profitability and efficient capital allocation.
Growth remains resilient, with revenue rising 15% and PAT growing 16% over the last year.
About 40% of returns stem from valuation re-rating — showcasing market confidence in these firms’ long-term potential.
Trading at 12–15x P/E and averaging ₹15,000 Cr in market cap, these mid-cap firms offer a compelling mix of growth, scale, and value.
What Makes FidelFolio Different
Discover how FidelFolio empowers investors with transparent, data-driven investment strategies grounded in 25+ years of historical analysis.
Introducing MAGIC 2.0 – AI for Smarter Investing
Our proprietary AI-ML engine, MAGIC 2.0, tests and combines over 3 lakh investment rules, leveraging decades of financial data to surface the most reliable strategies.
- 20 elite rules powering the Large Cap Dream Funds
- High-return strategies with low downside risk
- Fully transparent fixed-fee structure
Why Trust FidelFolio
At FidelFolio, we prioritize transparency, credibility, and investor-first principles to build confidence and long-term wealth.
We’re not just building portfolios. We’re building investor confidence.
Check out our PortfolioFrequently Asked Questions
At FidelFolio, we follow a quantitative long-term investing approach based on fundamental analysis. Over long-term, company’s business fundamentals determine investment outcomes. Read more about our Investment process.
₹1,80,000 via your own Smallcase account.
Typically once a quarter or when required, with a long-term perspective.
An AUM (Assets Under Management) based fee. No hidden charges, no commissions.
No. It’s a rule-based portfolio managed via your Smallcase account. You keep full control of your investments.
The Market Reward Discipline. Not Guesswork
If you’re ready to leave behind high fees, emotion-driven investing, and inconsistent returns, it’s time to upgrade.
💬 Join Our WhatsApp Channel
Be the first to get investment learning insights, exclusive updates about FidelFolio research, products, and reports, and instant notifications about upcoming webinars. Join our WhatsApp channel and never miss an opportunity to stay informed.
Join WhatsApp Channel